Case Study Gallery

Explore in-depth stories from fifteen years of design research, highlighting methods, findings, and international collaborations that shaped the field of collaborative information visualization.

An overhead bird’s-eye view of a large, pristine white table covered with neatly arranged printed geospatial interface mockups. Each sheet shows different map-based layouts, legend designs, and interaction flows in a restrained palette of charcoal, soft blue, and muted green. Thin acrylic rulers, graphite mechanical pencils, and a silver laptop with its lid closed line the table edges in a precise grid. Soft overcast daylight from a skylight above creates uniform, shadow-free illumination, reinforcing a sense of clarity and order. The composition is carefully centered and symmetrical, with sharp focus across the entire frame. The mood is methodical and reflective, emphasizing structured design research and a clean, modern, photographic aesthetic.
A single, large 4K monitor on a matte black stand displays a collaborative geospatial dashboard split into four coordinated views: a central map, a timeline, a network diagram, and a metrics panel, all using a restrained palette of cool grays, deep navy, and subtle cyan highlights. The monitor sits on a smooth, light concrete desk against a soft taupe wall, with a compact black notebook and a fine-line pen neatly aligned beside it. Directional side lighting from the left creates gentle gradients on the wall and precise shadows under the monitor stand. Captured at eye level with an asymmetric composition following the rule of thirds, the image has a calm, contemplative, and highly professional mood with clean photographic realism.
A dark charcoal background framing a floating, semi-transparent 3D globe composed of intersecting thin white latitude and longitude lines and softly glowing data arcs in desaturated teal and amber, representing global collaboration. Hovering around the globe are faint, rectangular UI panels with minimalist icons for layers, filters, and annotations, all rendered in subtle grayscale. A cool, focused spotlight from above and slightly behind creates a gentle halo around the sphere and delicate rim lighting on the arcs, fading into velvety darkness. Shot in a centered, front-facing composition with deep contrast and sharp focus on the globe, the atmosphere is precise, technical, and visionary, combining photographic realism with a clean, corporate, conceptual aesthetic.
A long, built-in digital wall composed of seamlessly tiled, ultra-thin displays showing a continuous geospatial visualization that transitions from a detailed city map on the left to abstracted regional patterns on the right. Colors are restrained: slate blue water, soft gray land, and subtle coral highlights for key data clusters. A narrow bench of light oak runs along the base of the wall, completely empty, emphasizing minimalism. Indirect ceiling lighting washes the upper wall with a soft glow, while a linear floor light grazes the bench, creating refined horizontal lines. Captured from a low, wide-angle perspective that emphasizes the length and cohesion of the display, the mood is immersive yet composed, reflecting large-scale, collaborative visualization in a sophisticated corporate environment.
A large ultra-high-resolution wall display showing an intricate geospatial data visualization: layered translucent maps in soft blues and neutral grays, with precise node-link overlays and polygon heat zones in muted teal and amber. The display is mounted on a clean, matte white wall above a minimal light-wood console that holds a single closed graphite-gray laptop. Soft, diffused daylight enters from an unseen window, creating gentle reflections on the screen and subtle shadows under the console. Shot at eye level with a balanced, symmetrical composition and sharp focus. The mood is professional, calm, and analytical, with a photographic realism and corporate, minimalist aesthetic emphasizing clarity and structure.

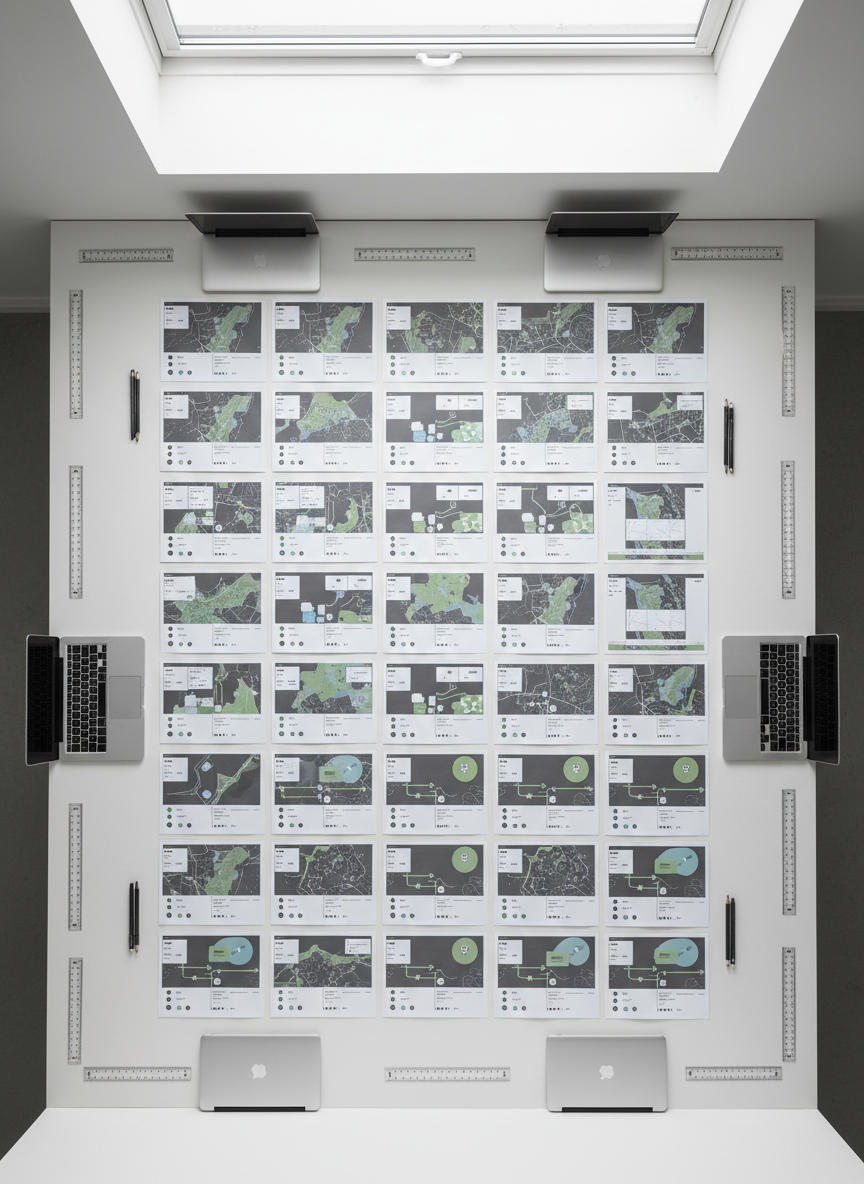
Collaborative Visualization Projects

We present concise project overviews alongside central research questions, study designs, and direct links to detailed case studies for each collaborative visualization interface.